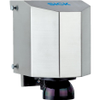
Vaisala Boundary Layer View Software BL-VIEW

Description
Visualize the mixing layer height 24/7 to improve your air quality monitoring and forecasting BL-View generates an online visual representation of the mixing layer height that provides you with an immediate understanding of local conditions. The mixing layer height data can be seamlessly integrated into external applications, forecasting, and numerical model verification. You can view and analyze logged data while logging and displaying real-time data. The insights enabled by BL-View help to improve your air quality monitoring and forecasting. Features  • Displays and logs data from a ceilometer while running other Windows-based applications  • Viewing and analyzing of already logged data simultaneously while logging and displaying real-time data  • Real-time boundary layer evolution with quality index with 24/7 operation  • Maintenance access to Ceilometer via an internal terminal program  • Supports Vaisala Ceilometers CL31 and CL51 Key Benefits • Automatic 24/7 visualization of the mixing layer height evolution   • BL-View generates an online visual representation of the mixing layer height (MLH) that provides you with an immediate understanding of local conditions. The accuracy of the measurement is verified by radiosondes. Monitor the evolution of the mixing layer height in real-time with additional information of other layers aloft, to improve your understanding of your current and near future air quality condition.  • Manage Your Ceilometer Network   • Up to 10 ceilometers can be connected to BL-View, providing a centralized view of the ceilometer data in the network. This facilitates concentrated data analysis. The status information of the network is available in one place.  • Flexible user interface   • The clear graphical user interface allows easy and convenient multiprocessing. Operators can zoom in on any point in a detailed analysis. The ceilometer and communication status is permanently displayed on the main screen so that possible operational warnings and alarms can be investigated.  • Reliable data whatever the weather   • To ensure reliable reporting in all weather conditions, BL-View also uses an all-weather algorithm that takes into account possible precipitation and cloud events.  • Fast data analysis   • The automatically analyzed boundary layer data is stored in log files that can be easily transferred to other applications, for example as inputs to numerical weather prediction models.
Datasheet
Description
Visualize the mixing layer height 24/7 to improve your air quality monitoring and forecasting BL-View generates an online visual representation of the mixing layer height that provides you with an immediate understanding of local conditions. The mixing layer height data can be seamlessly integrated into external applications, forecasting, and numerical model verification. You can view and analyze logged data while logging and displaying real-time data. The insights enabled by BL-View help to improve your air quality monitoring and forecasting. Features  • Displays and logs data from a ceilometer while running other Windows-based applications  • Viewing and analyzing of already logged data simultaneously while logging and displaying real-time data  • Real-time boundary layer evolution with quality index with 24/7 operation  • Maintenance access to Ceilometer via an internal terminal program  • Supports Vaisala Ceilometers CL31 and CL51 Key Benefits • Automatic 24/7 visualization of the mixing layer height evolution   • BL-View generates an online visual representation of the mixing layer height (MLH) that provides you with an immediate understanding of local conditions. The accuracy of the measurement is verified by radiosondes. Monitor the evolution of the mixing layer height in real-time with additional information of other layers aloft, to improve your understanding of your current and near future air quality condition.  • Manage Your Ceilometer Network   • Up to 10 ceilometers can be connected to BL-View, providing a centralized view of the ceilometer data in the network. This facilitates concentrated data analysis. The status information of the network is available in one place.  • Flexible user interface   • The clear graphical user interface allows easy and convenient multiprocessing. Operators can zoom in on any point in a detailed analysis. The ceilometer and communication status is permanently displayed on the main screen so that possible operational warnings and alarms can be investigated.  • Reliable data whatever the weather   • To ensure reliable reporting in all weather conditions, BL-View also uses an all-weather algorithm that takes into account possible precipitation and cloud events.  • Fast data analysis   • The automatically analyzed boundary layer data is stored in log files that can be easily transferred to other applications, for example as inputs to numerical weather prediction models.
Datasheet

Suppliers

Company
Product
Description
Supplier Links
Boundary Layer View Software BL-VIEW -  - Vaisala
Burlington, MA, United States
Boundary Layer View Software BL-VIEW
Visualize the mixing layer height 24/7 to improve your air quality monitoring and forecasting BL-View generates an online visual representation of the mixing layer height that provides you with an immediate understanding of local conditions. The mixing layer height data can be seamlessly integrated into external applications, forecasting, and numerical model verification. You can view and analyze logged data while logging and displaying real-time data. The insights enabled by BL-View help to improve your air quality monitoring and forecasting. Features  • Displays and logs data from a ceilometer while running other Windows-based applications  • Viewing and analyzing of already logged data simultaneously while logging and displaying real-time data  • Real-time boundary layer evolution with quality index with 24/7 operation  • Maintenance access to Ceilometer via an internal terminal program  • Supports Vaisala Ceilometers CL31 and CL51 Key Benefits • Automatic 24/7 visualization of the mixing layer height evolution   • BL-View generates an online visual representation of the mixing layer height (MLH) that provides you with an immediate understanding of local conditions. The accuracy of the measurement is verified by radiosondes. Monitor the evolution of the mixing layer height in real-time with additional information of other layers aloft, to improve your understanding of your current and near future air quality condition.  • Manage Your Ceilometer Network   • Up to 10 ceilometers can be connected to BL-View, providing a centralized view of the ceilometer data in the network. This facilitates concentrated data analysis. The status information of the network is available in one place.  • Flexible user interface   • The clear graphical user interface allows easy and convenient multiprocessing. Operators can zoom in on any point in a detailed analysis. The ceilometer and communication status is permanently displayed on the main screen so that possible operational warnings and alarms can be investigated.  • Reliable data whatever the weather   • To ensure reliable reporting in all weather conditions, BL-View also uses an all-weather algorithm that takes into account possible precipitation and cloud events.  • Fast data analysis   • The automatically analyzed boundary layer data is stored in log files that can be easily transferred to other applications, for example as inputs to numerical weather prediction models.

Visualize the mixing layer height 24/7 to improve your air quality monitoring and forecasting

BL-View generates an online visual representation of the mixing layer height that provides you with an immediate understanding of local conditions. The mixing layer height data can be seamlessly integrated into external applications, forecasting, and numerical model verification. You can view and analyze logged data while logging and displaying real-time data. The insights enabled by BL-View help to improve your air quality monitoring and forecasting.

Features  • Displays and logs data from a ceilometer while running other Windows-based applications  • Viewing and analyzing of already logged data simultaneously while logging and displaying real-time data  • Real-time boundary layer evolution with quality index with 24/7 operation  • Maintenance access to Ceilometer via an internal terminal program  • Supports Vaisala Ceilometers CL31 and CL51

Key Benefits

 • Automatic 24/7 visualization of the mixing layer height evolution   • BL-View generates an online visual representation of the mixing layer height (MLH) that provides you with an immediate understanding of local conditions. The accuracy of the measurement is verified by radiosondes. Monitor the evolution of the mixing layer height in real-time with additional information of other layers aloft, to improve your understanding of your current and near future air quality condition.
 • Manage Your Ceilometer Network   • Up to 10 ceilometers can be connected to BL-View, providing a centralized view of the ceilometer data in the network. This facilitates concentrated data analysis. The status information of the network is available in one place.
 • Flexible user interface   • The clear graphical user interface allows easy and convenient multiprocessing. Operators can zoom in on any point in a detailed analysis. The ceilometer and communication status is permanently displayed on the main screen so that possible operational warnings and alarms can be investigated.
 • Reliable data whatever the weather   • To ensure reliable reporting in all weather conditions, BL-View also uses an all-weather algorithm that takes into account possible precipitation and cloud events.
 • Fast data analysis   • The automatically analyzed boundary layer data is stored in log files that can be easily transferred to other applications, for example as inputs to numerical weather prediction models.

Supplier's Site Datasheet

Technical Specifications

  Vaisala
Product Category Uncategorized Products
Product Name Boundary Layer View Software BL-VIEW
Unlock Full Specs
to access all available technical data

Similar Products