INTEG Process Group, Inc. JNIOR Software Utility Usage Monitor

Description
he Utility Usage Monitor application is a software program that runs on the INTEG JNIOR to help you monitor your utility meters (gas, water, electric, steam, etc.) and report your totalized consumption on an hourly, daily, weekly, monthly and yearly basis. It can also chart the instantaneous flow for the utility. The Utility Usage Monitor application requires, at a minimum, 1 pulsed signal connected to one digital input on the JNIOR that represents a totalized pulse of x amount of the utility (gas, electric, etc.) where x is determined by the meter configuration. The pulses are counted on the JNIOR to sum the flow on an hourly basis. An optional analog signal representing the instantaneous flow can be connected to an analog expansion module. The Utility Usage Monitor application can handle up to four (4) meters (one pulsed signal and one instantaneous flow per meter). The instantaneous chart displays the instantaneous flow for the utility meter (if the signal is available). The amount of data loaded when you first launch the web page is defined by the Hours to Dump Registry Key. The chart has additional options that allow you to change the amount of data (time based) to display to 1 Hour, 2 Hours, 4 Hours, 8 Hours, and Show All. The default is Show All. Once you select another option, the web page will continuously display that amount of data. You can also scroll left or right in the graph by ‘left clicking’ on the graph and dragging your cursor left or right. The Utility Usage Monitoring System logs the utility consumption on an hourly, daily, weekly, monthly and yearly basis. The utility consumption data is stored on the JNIOR in the www/logs directory on the following time intervals: Hourly – a rolling 24 hour file (new hour replaces oldest hour, so oldest data – 25th hour – is overwritten every hour) and stored as hourly.csv. Weekly – a rolling 7 day file (new day replaces oldest day at midnight, so oldest data – 8th day – is overwritten at midnight) and stored as weekly.csv. Monthly – a file created for each month of the year (not deleted, but will be overwritten when the month occurs in the following year) and stored, for example, as Jan.csv where Jan represents the month of January, and so on. Yearly – a file created once a year (not deleted, but overwritten at the beginning of the new year) and stored as yearly.csv.
Description
he Utility Usage Monitor application is a software program that runs on the INTEG JNIOR to help you monitor your utility meters (gas, water, electric, steam, etc.) and report your totalized consumption on an hourly, daily, weekly, monthly and yearly basis. It can also chart the instantaneous flow for the utility. The Utility Usage Monitor application requires, at a minimum, 1 pulsed signal connected to one digital input on the JNIOR that represents a totalized pulse of x amount of the utility (gas, electric, etc.) where x is determined by the meter configuration. The pulses are counted on the JNIOR to sum the flow on an hourly basis. An optional analog signal representing the instantaneous flow can be connected to an analog expansion module. The Utility Usage Monitor application can handle up to four (4) meters (one pulsed signal and one instantaneous flow per meter). The instantaneous chart displays the instantaneous flow for the utility meter (if the signal is available). The amount of data loaded when you first launch the web page is defined by the Hours to Dump Registry Key. The chart has additional options that allow you to change the amount of data (time based) to display to 1 Hour, 2 Hours, 4 Hours, 8 Hours, and Show All. The default is Show All. Once you select another option, the web page will continuously display that amount of data. You can also scroll left or right in the graph by ‘left clicking’ on the graph and dragging your cursor left or right. The Utility Usage Monitoring System logs the utility consumption on an hourly, daily, weekly, monthly and yearly basis. The utility consumption data is stored on the JNIOR in the www/logs directory on the following time intervals: Hourly – a rolling 24 hour file (new hour replaces oldest hour, so oldest data – 25th hour – is overwritten every hour) and stored as hourly.csv. Weekly – a rolling 7 day file (new day replaces oldest day at midnight, so oldest data – 8th day – is overwritten at midnight) and stored as weekly.csv. Monthly – a file created for each month of the year (not deleted, but will be overwritten when the month occurs in the following year) and stored, for example, as Jan.csv where Jan represents the month of January, and so on. Yearly – a file created once a year (not deleted, but overwritten at the beginning of the new year) and stored as yearly.csv.

Suppliers

Company
Product
Description
Supplier Links
JNIOR Software - Utility Usage Monitor - INTEG Process Group, Inc.
Gibsonia, PA, United States
he Utility Usage Monitor application is a software program that runs on the INTEG JNIOR to help you monitor your utility meters (gas, water, electric, steam, etc.) and report your totalized consumption on an hourly, daily, weekly, monthly and yearly basis. It can also chart the instantaneous flow for the utility. The Utility Usage Monitor application requires, at a minimum, 1 pulsed signal connected to one digital input on the JNIOR that represents a totalized pulse of x amount of the utility (gas, electric, etc.) where x is determined by the meter configuration. The pulses are counted on the JNIOR to sum the flow on an hourly basis. An optional analog signal representing the instantaneous flow can be connected to an analog expansion module. The Utility Usage Monitor application can handle up to four (4) meters (one pulsed signal and one instantaneous flow per meter). The instantaneous chart displays the instantaneous flow for the utility meter (if the signal is available). The amount of data loaded when you first launch the web page is defined by the Hours to Dump Registry Key. The chart has additional options that allow you to change the amount of data (time based) to display to 1 Hour, 2 Hours, 4 Hours, 8 Hours, and Show All. The default is Show All. Once you select another option, the web page will continuously display that amount of data. You can also scroll left or right in the graph by ‘left clicking’ on the graph and dragging your cursor left or right. The Utility Usage Monitoring System logs the utility consumption on an hourly, daily, weekly, monthly and yearly basis. The utility consumption data is stored on the JNIOR in the www/logs directory on the following time intervals: Hourly – a rolling 24 hour file (new hour replaces oldest hour, so oldest data – 25th hour – is overwritten every hour) and stored as hourly.csv. Weekly – a rolling 7 day file (new day replaces oldest day at midnight, so oldest data – 8th day – is overwritten at midnight) and stored as weekly.csv. Monthly – a file created for each month of the year (not deleted, but will be overwritten when the month occurs in the following year) and stored, for example, as Jan.csv where Jan represents the month of January, and so on. Yearly – a file created once a year (not deleted, but overwritten at the beginning of the new year) and stored as yearly.csv.

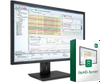
he Utility Usage Monitor application is a software program that runs on the INTEG JNIOR to help you monitor your utility meters (gas, water, electric, steam, etc.) and report your totalized consumption on an hourly, daily, weekly, monthly and yearly basis. It can also chart the instantaneous flow for the utility.

The Utility Usage Monitor application requires, at a minimum, 1 pulsed signal connected to one digital input on the JNIOR that represents a totalized pulse of x amount of the utility (gas, electric, etc.) where x is determined by the meter configuration. The pulses are counted on the JNIOR to sum the flow on an hourly basis. An optional analog signal representing the instantaneous flow can be connected to an analog expansion module. The Utility Usage Monitor application can handle up to four (4) meters (one pulsed signal and one instantaneous flow per meter).

The instantaneous chart displays the instantaneous flow for the utility meter (if the signal is available). The amount of data loaded when you first launch the web page is defined by the Hours to Dump Registry Key. The chart has additional options that allow you to change the amount of data (time based) to display to 1 Hour, 2 Hours, 4 Hours, 8 Hours, and Show All. The default is Show All. Once you select another option, the web page will continuously display that amount of data. You can also scroll left or right in the graph by ‘left clicking’ on the graph and dragging your cursor left or right.

The Utility Usage Monitoring System logs the utility consumption on an hourly, daily, weekly, monthly and yearly basis. The utility consumption data is stored on the JNIOR in the www/logs directory on the following time intervals:

  • Hourly – a rolling 24 hour file (new hour replaces oldest hour, so oldest data – 25th hour – is overwritten every hour) and stored as hourly.csv.
  • Weekly – a rolling 7 day file (new day replaces oldest day at midnight, so oldest data – 8th day – is overwritten at midnight) and stored as weekly.csv.
  • Monthly – a file created for each month of the year (not deleted, but will be overwritten when the month occurs in the following year) and stored, for example, as Jan.csv where Jan represents the month of January, and so on.
  • Yearly – a file created once a year (not deleted, but overwritten at the beginning of the new year) and stored as yearly.csv.

Supplier's Site

Technical Specifications

  INTEG Process Group, Inc.
Product Category Data Acquisition Software
Product Number Utility Usage Monitor
Product Name JNIOR Software
Unlock Full Specs
to access all available technical data

Similar Products