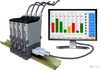
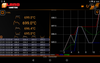
Cleverscope, Ltd. CS300 Application Software

Description
Displays Simultaneous Scope, Tracking, Spectrum, Signal Information, Maths, XY, Control Panel, Protocol and Trigger setup Displays Linking All the graphs can be linked to the current tracer position for tracking zoom, maths and spectrum displays. Graph features All graphs include variable persistence, tracer, markers, annotations, user defined colours and units, graph size and location. The spectrum graph has log/linear axis. Copy and paste All graphs, and signal information can be copy/pasted into Windows documents. Print All displays can be printed. File Signal data can be saved and opened as cleverscope, text or binary. The cleverscope format includes the complete display setup. File Actions Files can be saved or opened manually, on a trigger, after a period of time, or initiated by Maths. Triggers Define dual mixed signal triggers -filter, amplitude, slope, period between triggers, and trigger count. Capture Types One shot triggered (-20 - 20 secs), continuous streaming (up to 100 G samples) Signal Information Display DC, RMS, Max, Min, Pk-pk, Std Dev, Period, Frequency, Pulse Length, Duty Cycle, Harmonics, Sinad, THD and HD2-3. Log to a text or Excel file. Link live to Excel. Spectrum Select span and resolution. Apply averaging. Log or linear. Select windowing function and spectrum type (RMS, power, power density, gain/phase). Maths 10 arbitrary symbolic equations, large number of functions and processes, including filtering, integration, signal processing and signal generator control, Matlab live connect and file save. Protocol Setup and decode SPI, I2C, Uart and Bus signals. Charting Stream to disk at up to 1.5 MSPS continuously. Pan and zoom anywhere.

Suppliers

Company
Product
Description
Supplier Links
Displays Simultaneous Scope, Tracking, Spectrum, Signal Information, Maths, XY, Control Panel, Protocol and Trigger setup Displays Linking All the graphs can be linked to the current tracer position for tracking zoom, maths and spectrum displays. Graph features All graphs include variable persistence, tracer, markers, annotations, user defined colours and units, graph size and location. The spectrum graph has log/linear axis. Copy and paste All graphs, and signal information can be copy/pasted into Windows documents. Print All displays can be printed. File Signal data can be saved and opened as cleverscope, text or binary. The cleverscope format includes the complete display setup. File Actions Files can be saved or opened manually, on a trigger, after a period of time, or initiated by Maths. Triggers Define dual mixed signal triggers -filter, amplitude, slope, period between triggers, and trigger count. Capture Types One shot triggered (-20 - 20 secs), continuous streaming (up to 100 G samples) Signal Information Display DC, RMS, Max, Min, Pk-pk, Std Dev, Period, Frequency, Pulse Length, Duty Cycle, Harmonics, Sinad, THD and HD2-3. Log to a text or Excel file. Link live to Excel. Spectrum Select span and resolution. Apply averaging. Log or linear. Select windowing function and spectrum type (RMS, power, power density, gain/phase). Maths 10 arbitrary symbolic equations, large number of functions and processes, including filtering, integration, signal processing and signal generator control, Matlab live connect and file save. Protocol Setup and decode SPI, I2C, Uart and Bus signals. Charting Stream to disk at up to 1.5 MSPS continuously. Pan and zoom anywhere.

Displays

Simultaneous Scope, Tracking, Spectrum, Signal Information, Maths, XY, Control Panel, Protocol and Trigger setup Displays

Linking

All the graphs can be linked to the current tracer position for tracking zoom, maths and spectrum displays.

Graph features

All graphs include variable persistence, tracer, markers, annotations, user defined colours and units, graph size and location. The spectrum graph has log/linear axis.

Copy and paste

All graphs, and signal information can be copy/pasted into Windows documents.

Print

All displays can be printed.

File

Signal data can be saved and opened as cleverscope, text or binary. The cleverscope format includes the complete display setup.

File Actions

Files can be saved or opened manually, on a trigger, after a period of time, or initiated by Maths.

Triggers

Define dual mixed signal triggers -filter, amplitude, slope, period between triggers, and trigger count.

Capture Types

One shot triggered (-20 - 20 secs), continuous streaming (up to 100 G samples)

Signal Information

Display DC, RMS, Max, Min, Pk-pk, Std Dev, Period, Frequency, Pulse Length, Duty Cycle, Harmonics, Sinad, THD and HD2-3. Log to a text or Excel file. Link live to Excel.

Spectrum

Select span and resolution. Apply averaging. Log or linear. Select windowing function and spectrum type (RMS, power, power density, gain/phase).

Maths

10 arbitrary symbolic equations, large number of functions and processes, including filtering, integration, signal processing and signal generator control, Matlab live connect and file save.

Protocol

Setup and decode SPI, I2C, Uart and Bus signals.

Charting

Stream to disk at up to 1.5 MSPS continuously. Pan and zoom anywhere.
Supplier's Site

Technical Specifications

  Cleverscope, Ltd.
Product Category Data Acquisition Software
Product Number CS300 Application Software
Unlock Full Specs
to access all available technical data

Similar Products