Zygo Corporation Software for 2D and 3D Metrology Data Exploration

Description
Mx™ for 2D and 3D Metrology Data Exploration | Zygo ZYGO’s Mx™ software is a complete data analysis suite for surface topography and wavefront data. With powerful tools and sleek visualizations, exploration and analysis of data is fast and easy. Key Features 2D and 3D Metrology Utilize interactive 3D plots and areal results, or extract profile data for 2D analysis. Matrix Processing at your Fingertips. Mx provides simple, GUI-configured tools for common processing tasks like fitting and removing, filtering, data interpolation, outlier removal, and many more. Powerful Analysis Toolkits. Simulate the optical performance of your measured part by viewing the Modulation Transfer Function, Point Spread Function, and Encircled Energy Calculation. Or, analyze the lubricant retention of a bearing with Material Ratio Analysis. With these tools and more, Mx provides a simple interface to powerful analysis. Regions Segmentation. Leverage a powerful segmentation engine to solve a variety of problems. Smart, robust step height calculation. Defect detection. ISO-25178 Watershed analysis. The Regions package provides a host of quantitative results, easily calculated for hundreds or thousands of regions. Simple Data Exchange. Read and write files in the industry standard MetroPro DAT format, as well as the HDF5-based DATX file format. Send your data to Matlab with provided sample code or export your data to CODE V or Zemax as an INT grid phase or Zernike coefficient file. ZYGO file formats are documented, supported and open, so you can use your data, your way.

Suppliers

Company
Product
Description
Supplier Links
Software for 2D and 3D Metrology Data Exploration -  - Zygo Corporation
Middlefield, CT, United States
Software for 2D and 3D Metrology Data Exploration
Mx™ for 2D and 3D Metrology Data Exploration | Zygo ZYGO’s Mx™ software is a complete data analysis suite for surface topography and wavefront data. With powerful tools and sleek visualizations, exploration and analysis of data is fast and easy. Key Features 2D and 3D Metrology Utilize interactive 3D plots and areal results, or extract profile data for 2D analysis. Matrix Processing at your Fingertips. Mx provides simple, GUI-configured tools for common processing tasks like fitting and removing, filtering, data interpolation, outlier removal, and many more. Powerful Analysis Toolkits. Simulate the optical performance of your measured part by viewing the Modulation Transfer Function, Point Spread Function, and Encircled Energy Calculation. Or, analyze the lubricant retention of a bearing with Material Ratio Analysis. With these tools and more, Mx provides a simple interface to powerful analysis. Regions Segmentation. Leverage a powerful segmentation engine to solve a variety of problems. Smart, robust step height calculation. Defect detection. ISO-25178 Watershed analysis. The Regions package provides a host of quantitative results, easily calculated for hundreds or thousands of regions. Simple Data Exchange. Read and write files in the industry standard MetroPro DAT format, as well as the HDF5-based DATX file format. Send your data to Matlab with provided sample code or export your data to CODE V or Zemax as an INT grid phase or Zernike coefficient file. ZYGO file formats are documented, supported and open, so you can use your data, your way.
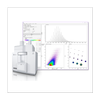
Mx™ for 2D and 3D Metrology Data Exploration | Zygo

ZYGO’s Mx™ software is a complete data analysis suite for surface topography and wavefront data. With powerful tools and sleek visualizations, exploration and analysis of data is fast and easy.

Key Features

2D and 3D Metrology Utilize interactive 3D plots and areal results, or extract profile data for 2D analysis.

Matrix Processing at your Fingertips. Mx provides simple, GUI-configured tools for common processing tasks like fitting and removing, filtering, data interpolation, outlier removal, and many more.

Powerful Analysis Toolkits. Simulate the optical performance of your measured part by viewing the Modulation Transfer Function, Point Spread Function, and Encircled Energy Calculation. Or, analyze the lubricant retention of a bearing with Material Ratio Analysis. With these tools and more, Mx provides a simple interface to powerful analysis.

Regions Segmentation. Leverage a powerful segmentation engine to solve a variety of problems. Smart, robust step height calculation. Defect detection. ISO-25178 Watershed analysis. The Regions package provides a host of quantitative results, easily calculated for hundreds or thousands of regions.

Simple Data Exchange. Read and write files in the industry standard MetroPro DAT format, as well as the HDF5-based DATX file format. Send your data to Matlab with provided sample code or export your data to CODE V or Zemax as an INT grid phase or Zernike coefficient file. ZYGO file formats are documented, supported and open, so you can use your data, your way.

Supplier's Site

Technical Specifications

  Zygo Corporation
Product Category Image Analysis Software
Product Name Software for 2D and 3D Metrology Data Exploration
Unlock Full Specs
to access all available technical data

Similar Products