DESCRIPTION
For the first time process data can be stored with a high frequency and evaluated offline, providing for the user detailed and complete information about the whole production run. Different machines, machine and tool settings, tool and material supplier can be compared and effectively evaluated and conclusions can be made to optimize production, increase productivity and reduce scrap production.
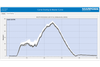
The XBrowser is a server based software tool for the transmission, visualization and storage of time, stroke or process faults event for Brankamp X units. In the TrendViewer software those stored process data files can be reloaded, displayed, filtered and evaluated with different methods and time intervals. Fast analyze of long production runs is easily possible, finding of failure curves, process variations or modification of monitoring limits can be done with a few clicks. The superimposition functions of curve data allows detailed view into selectable parts of the process behavior and conclusions about the production process can drawn about process stability and even tool wear.
Process Quality
stored long term process quality
easy search for process variation
complete process quality documentation
Vario Trend
detailed trend information
related to a free selectable curve area
detailed tool wear analysis
Master Curve
Master curve over all selected "production" curves
Reference curve for machine and tool setup
BENEFITS
This type of post-process data evaluation offers different users (e.g. production manager, tool designer, quality manager) :
The possibility to analyze and evaluate his entire process data for the first time
With this tool, important conclusions can be found about process variation, setting of monitoring limits and recognition of process influences during the whole production run
The knowledge acquired is helpful in determining the optimum process parameters and provides detailed conclusions about tool wear
DESCRIPTION
For the first time process data can be stored with a high frequency and evaluated offline, providing for the user detailed and complete information about the whole production run. Different machines, machine and tool settings, tool and material supplier can be compared and effectively evaluated and conclusions can be made to optimize production, increase productivity and reduce scrap production.
The XBrowser is a server based software tool for the transmission, visualization and storage of time, stroke or process faults event for Brankamp X units. In the TrendViewer software those stored process data files can be reloaded, displayed, filtered and evaluated with different methods and time intervals. Fast analyze of long production runs is easily possible, finding of failure curves, process variations or modification of monitoring limits can be done with a few clicks. The superimposition functions of curve data allows detailed view into selectable parts of the process behavior and conclusions about the production process can drawn about process stability and even tool wear.
Process Quality
- stored long term process quality
- easy search for process variation
- complete process quality documentation
Vario Trend
- detailed trend information
- related to a free selectable curve area
- detailed tool wear analysis
Master Curve
- Master curve over all selected "production" curves
- Reference curve for machine and tool setup
BENEFITS
This type of post-process data evaluation offers different users (e.g. production manager, tool designer, quality manager) :
- The possibility to analyze and evaluate his entire process data for the first time
- With this tool, important conclusions can be found about process variation, setting of monitoring limits and recognition of process influences during the whole production run
- The knowledge acquired is helpful in determining the optimum process parameters and provides detailed conclusions about tool wear