Software, PC or Mac, for automated image capture, optimization, and 1-D data analysis, for use with Gel Doc™ EZ, Gel Doc XR+, ChemiDoc™ XRS+, and ChemiDoc MP imaging systems
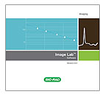
Image Lab™ image acquisition and analysis software runs the Gel Doc™ EZ imager* and the Gel Doc XR+ and ChemiDoc™ XRS+ imaging systems for capturing and analyzing digital image data from electrophoresis gels and blots. After the sample is loaded into the imager, a single integrated and automated workflow captures optimized image data, analyzes the gel or blot features, and produces a comprehensive report in mere seconds. Image Lab software includes detailed tutorials and requires no previous imaging experience to produce optimum gel and blot images.
Automated Workflow
Executes preprogrammed and user-created protocols to perform imaging experiments from image capture to analysis to printed reports with a single click of the mouse
Makes it easy to create protocols
Simplifies and optimizes imaging and analysis while saving time
Ensures that workflows are reproducible
System Optimization at Setup
Selects the proper settings for optimum detection conditions of the sample stain, label, or light-emitting reaction
Uses proprietary algorithms to calibrate the system for automatic control of focus at any zoom level and automatic correction of imaging artifacts
Performs flat fielding corrections specifically and consistently for every application
Generates accurate data and beautiful images
Automated or Manual Data Analysis
Performs all the image analysis steps automatically; can be user-modified for more precise band detection, control of background level, and choice of lane
Updates results tables instantly when experimental parameters are changed
Offers optional manual image analysis for adjustments by the user in every step
Displays MW (or base pair) values and presents a quantitative comparison to evaluate sample purity and identify sample components for all bands and lanes
Customized Data Tables, Reports, and Visuals
Generates a customized data table with all sample information organized lane by lane and band by band each time a data analysis is performed or modified
Copies any part of a data table to popular document processing applications such as Adobe Acrobat, Microsoft Word, or Microsoft Excel
Saves reports within customized protocols designed by the user
Provides multiple tools for displaying, viewing, and annotating images; imports Image Lab software visuals directly into publications and presentations
Software, PC or Mac, for automated image capture, optimization, and 1-D data analysis, for use with Gel Doc™ EZ, Gel Doc XR+, ChemiDoc™ XRS+, and ChemiDoc MP imaging systems
Image Lab™ image acquisition and analysis software runs the Gel Doc™ EZ imager* and the Gel Doc XR+ and ChemiDoc™ XRS+ imaging systems for capturing and analyzing digital image data from electrophoresis gels and blots. After the sample is loaded into the imager, a single integrated and automated workflow captures optimized image data, analyzes the gel or blot features, and produces a comprehensive report in mere seconds. Image Lab software includes detailed tutorials and requires no previous imaging experience to produce optimum gel and blot images.
Automated Workflow
- Executes preprogrammed and user-created protocols to perform imaging experiments from image capture to analysis to printed reports with a single click of the mouse
- Makes it easy to create protocols
- Simplifies and optimizes imaging and analysis while saving time
- Ensures that workflows are reproducible
System Optimization at Setup
- Selects the proper settings for optimum detection conditions of the sample stain, label, or light-emitting reaction
- Uses proprietary algorithms to calibrate the system for automatic control of focus at any zoom level and automatic correction of imaging artifacts
- Performs flat fielding corrections specifically and consistently for every application
- Generates accurate data and beautiful images
Automated or Manual Data Analysis
- Performs all the image analysis steps automatically; can be user-modified for more precise band detection, control of background level, and choice of lane
- Updates results tables instantly when experimental parameters are changed
- Offers optional manual image analysis for adjustments by the user in every step
- Displays MW (or base pair) values and presents a quantitative comparison to evaluate sample purity and identify sample components for all bands and lanes
Customized Data Tables, Reports, and Visuals
- Generates a customized data table with all sample information organized lane by lane and band by band each time a data analysis is performed or modified
- Copies any part of a data table to popular document processing applications such as Adobe Acrobat, Microsoft Word, or Microsoft Excel
- Saves reports within customized protocols designed by the user
- Provides multiple tools for displaying, viewing, and annotating images; imports Image Lab software visuals directly into publications and presentations